
Maps, like photographs, are capable of conveying a great deal of information in a single image – “A picture is worth a thousand words.” This collection of maps and satellite images illustrates certain key issues in Israel/Palestine. Brief interpretations of each image are provided, as well as links to other CJPME resources for further information. Many of the prevailing narratives on key issues in Israel/Palestine do not correspond with the facts. Well-designed maps can help convey those facts and demolish those myths in engaging and convincing ways. CJPME believes that these maps are amongst the best currently available to illustrate these issues.
Introduction
Maps, like photographs, are capable of conveying a great deal of information in a single image – “A picture is worth a thousand words.”
This collection of maps and satellite images illustrates certain key issues in Israel/Palestine. Brief interpretations of each image are provided, as well as links to other CJPME resources for further information.
Many of the prevailing narratives on key issues in Israel/Palestine do not correspond with the facts. Well-designed maps can help convey those facts and demolish those myths in engaging and convincing ways.
CJPME believes that these maps are amongst the best currently available to illustrate these issues.
We welcome readers’ comments and suggestions. Contact us at 438-380-5410 or [email protected].
History and Geography
For further information, consult the following CJPME resources:
- Jewish immigration to historical Palestine: http://www.cjpme.org/fs_181
- Historical Palestine’s Demography: http://www.cjpme.org/fs_182
- Palestine 1930: The Passfield White Paper: http://www.cjpme.org/fs_135
- Canadian Zionists Join World Wide Campaign to Mark Centenary of Balfour Declaration: https://blog-cjpme.nationbuilder.com/cjpme_blog_2017_04_13
Israel and its neighbours
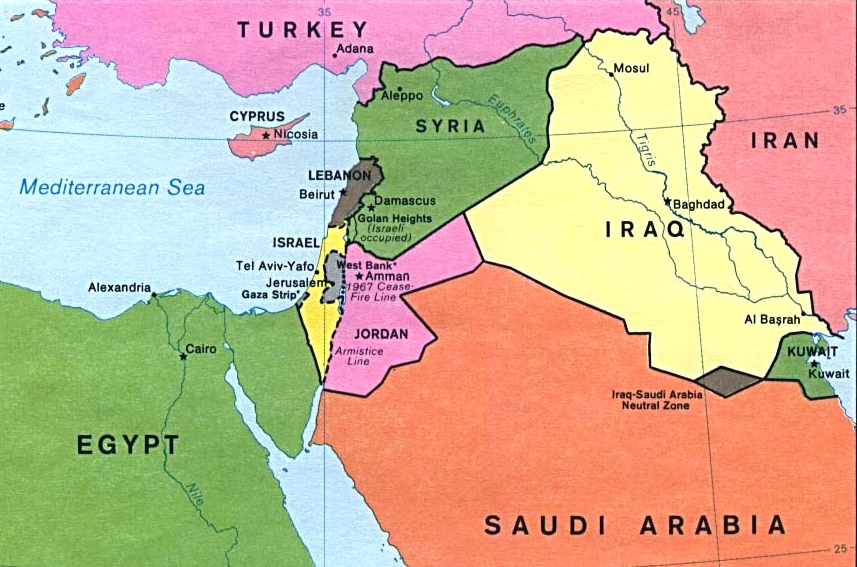
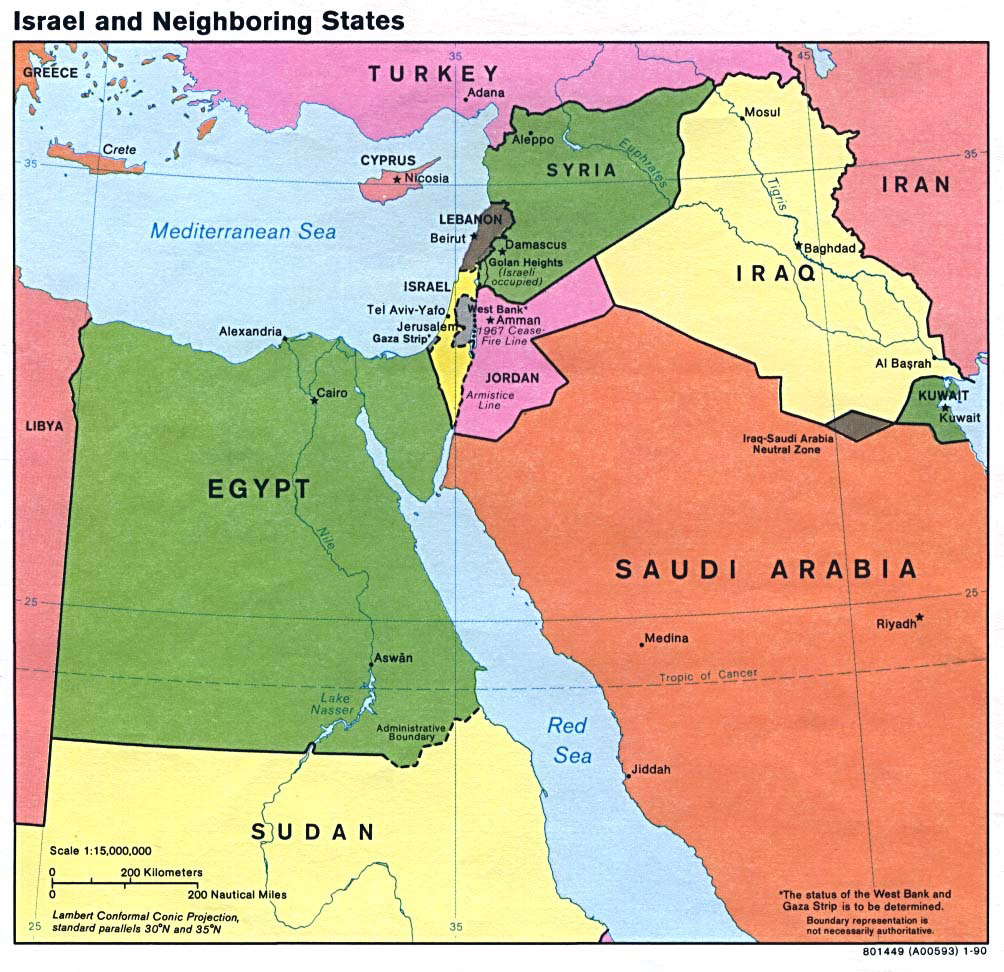
Israel (shown in yellow, at the centre of the map) is bordered by the Mediterranean Sea to the west, Egypt (in green) to the south, Jordan (pink) to the east, Syria (green) and Lebanon (dark grey) to the north. Since June 1967, Israel has occupied the Palestinian territories of the West Bank, including East Jerusalem, and the Gaza Strip (all in light grey), plus the Syrian Golan Heights (green).
Image source: http://www.maps-of-the-world.net/maps/maps-of-asia/maps-of-israel/large-map-of-israel-and-Neighboring-States-1990.jpg
Sykes-Picot

The Sykes–Picot Agreement was a secret 1916 pact between the United Kingdom and France, which carved up the Ottoman Empire between the presumptive victors of World War I. Britain took control of Palestine, Jordan and southern Iraq (the red and pink areas on the map), while France got control of southeastern Turkey, northern Iraq, Syria and Lebanon (the blue and green areas).
The Sykes–Picot Agreement was a turning point in Western and Arab relations. It negated the promise Britain had made to the Arabs for a national Arab homeland in the area of Greater Syria, in exchange for supporting the British against the Ottoman Empire during the First World War.
Following the war, the League of Nations formalized the Sykes–Picot Agreement by granting Britain and France mandates to govern these former Ottoman territories. Iraq gained independence in 1932, while Syria, Lebanon and Jordan gained independence in 1946. But this was not achieved in Palestine, and in 1947 Britain announced its intention to relinquish the mandate and turn it back over to the United Nations.
Image source: https://www.jewishvirtuallibrary.org/map-of-the-sykes-picot-agreement-1916
Jewish colonization before 1948

The Jewish land agents who purchased real estate for Jewish colonization during the British Mandate sought out large tracts of agricultural land in the fertile Coastal plains, Jezreel Valley and the Galilee (shown in the darker orange shade on this map). Through a policy of “Hebrew labour,” (an ideal of the Zionist movement which held that Jews should employ only Jews) many Palestinian farm workers were driven off the land, while Palestinian merchants and tradespeople also lost their businesses.
From a strategic perspective, the land agents deliberately strove to create contiguous, rather than scattered, holdings, allowing for secure travel and communications within the Jewish-controlled areas. The Jewish land holdings trisected Palestine, isolating and severing communications between its three major Palestinian population centres (Haifa, Jaffa and Jerusalem) – which proved decisive during the wars of 1947-1948.
Compare this map to Map #5 to see how much territory Jewish forces had already seized before the war with neighbouring Arab states even began in May 1948.
Image source: http://www.palestineremembered.com/Acre/Maps/Story571.html
The Nakba
For further information, consult the following CJPME resources:
- Jaffa oranges: Pride and propaganda: http://www.cjpme.org/fs_176
- The 1947 UN Partition Plan for Palestine: http://www.cjpme.org/fs_173
- Canada’s defunding of UNRWA’s core programs: http://www.cjpme.org/fs_125
- The Palestine Papers: Overview: http://www.cjpme.org/fs_108
- UNRWA, Myths and Facts: http://www.cjpme.org/fs_073
- UNRWA, History and Context: http://www.cjpme.org/fs_072
- Canada and Funding for UNRWA: http://www.cjpme.org/pp_23
- Canada and Palestinian Refugees: http://www.cjpme.org/pp_25
- Canada Must Do More Than Just Throw Money At Palestinian Refugees: https://blog-cjpme.nationbuilder.com/cjpme_blog_2017_08_29
UN Partition Plan

After Britain announced that it intended to terminate its mandate for Palestine, the UN General Assembly appointed a special committee to make recommendations on Palestine’s future government. There were competing proposals, but in the end the committee recommended the establishment of two separate states: Jewish (the blue area on this map) and Arab (the red area), to be joined by economic union, with the Jerusalem-Bethlehem region (the yellow area) as an enclave under international administration. Note that Jaffa, a predominantly Arab city of 95,000 and a major Mediterranean port, was to be part of the Arab state.
On November 29, 1947 the UN General Assembly voted on the Partition Plan, adopting it by 33 votes to 13, with 10 abstentions. Note that the General Assembly of 1947 was a very different body than it is today. There were only 57 member states in all, mostly comprised of the Allied powers from World War II, British Commonwealth nations and Latin American republics. Aside from these, there were only 9 member states from Asia and 3 from all of Africa.
Image source: http://www.mfa.gov.il/MFA/AboutIsrael/Maps/Pages/1947%20UN%20Partition%20Plan.aspx
Civil war
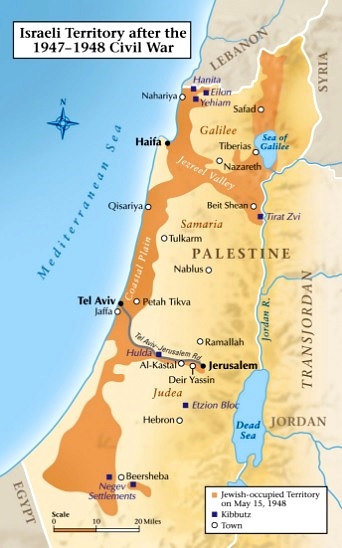
This map shows (in orange) how much Palestinian territory Jewish militias had already seized before the war with neighbouring Arab states had even started. Compare this map to Map #3 to see just how much territory was seized.
The accepted narrative has it that, when the British Mandate ended on May 15, 1948, armies of the surrounding Arab nations immediately launched an invasion of the nascent state of Israel. Israel emerged victorious, and in the process gained more territory than it had originally been allotted under the 1947 UN Partition Plan.
The reality is that there were two wars in Palestine in 1947-1948: A civil war between Jewish militias and Palestinian resistance within Mandate Palestine, which began in November 1947; and a conventional war between the Israeli army and the armed forces of neighbouring Arab states, which began in May 1948.
Jewish militias were mobilized and civil war broke out in Mandate Palestine on November 30, 1947 – the day following the UN Partition vote. By the time war broke out with neighbouring Arab states in May 1948, Jewish forces had already forced Palestinians out of the major urban centres of Jaffa, Haifa and Safad, and nearly 300,000 of Palestine’s 750,000 refugees had already been expelled or had fled for their lives.
Image source: http://www.historynet.com/lashing-back-israel-1947-1948-civil-war.htm
Refugees

Of the estimated 950,000 Palestinians who lived in the territory that became Israel, 750,000 were made refugees and 50,000 were internally displaced by the wars of 1947-1948. This map shows the number of Palestinian refugees who fled for their lives, as well as the routes along which they were expelled. Today, the vast majority of Palestinian refugees live within 100 km of their former homes.
The map shows the number of rural (“R”) and urban (“U”) refugees expelled from each district in Palestine. Note the number of refugees from the large urban areas of Haifa, Jaffa, al-Ramla and Jerusalem. Palestinians were not all rural peasants, as they are most often portrayed. Jaffa (population 95,000), for example, was a major commercial, industrial and banking centre and Mediterranean port, boasting 47 schools and 14 newspapers, some with national and international readerships.
Image source: http://www.palestineremembered.com/Acre/Maps/Story578.html
Destroyed villages

Of the nearly 600 Palestinian villages and towns overrun by Jewish and Israeli forces during the wars of 1947-1948, over 400 (shown as black dots on this map) were subsequently completely destroyed or rendered permanently uninhabitable. Elsewhere, Palestinian communities were repopulated by Jewish immigrants, then renamed.
Of the estimated 950,000 Palestinians who lived in the territory that became Israel, 750,000 were made refugees. An additional 50,000 were internally displaced. Like the refugees, these so-called “present absentees” have never been allowed to return to their homes.
Image source: http://www.passia.org/maps/view/18
Dispossession

Map 1: Following World War II, land ownership in Israel-Palestine was roughly 6% Jewish, and 94% Palestinian. This, despite massive emmigration by Jews to the region in the decades prior.
Map 2: The UN Partition Plan of 1947 allocated 53% of the land to a Jewish-majority state, and 47% of the land to a Palestinian-majority state. At this time, the Jews only represented 33% of the population of Israel-Palestine. Western countries voted in support of the Plan, while almost all Asian and African countries voted against it.
Map 3: In the armed conflict of 1948, Israel defeated its opponents, and seized vast amounts of land intended for the Palestinian-majority state. At least 700,000 Palestinians became refugees between 1947-1949, yet Israel has never permitted these refugees to return. In 1967, Israel invaded the West Bank and Gaza, and has militarily controlled these territories ever since.
Map 4: With its military occupation of the West Bank, Israel continues to confiscate land with illegal Jewish-only colonies (a.k.a. “settlements”), Jewish-only roads, “security” zones, and a 700-km. Wall. Palestinians are separated from their lands, their schools, health services, and neighbouring Palestinian communities by what some now call Israel’s “matrix of control.”
Text and image source: http://www.cjpme.org/understanding_bds
The Occupation
For further information, consult the following CJPME resources:
- Illegal Israeli colonies in the occupied Palestinian territories: http://www.cjpme.org/fs_076
- Israeli colonization of East Jerusalem: http://www.cjpme.org/fs_078
- Mainstream public opposition to Israeli “settlements”: http://www.cjpme.org/fs_158
- “Settlement” products and companies to boycott: http://www.cjpme.org/fs_157
- The Palestine Papers: Overview: http://www.cjpme.org/fs_108
- CJPME’s Boycott Campaign on Israel: http://www.cjpme.org/fs_096
- Canada, Israeli Colonies and Peace in the Middle East: http://www.cjpme.org/pp_30
- Canada's Flip-flop On West Bank Wines Betrays Canadian Consumers' Interests: https://blog-cjpme.nationbuilder.com/cjpme_blog_2017_07_18
- 50 Years Of Israeli Occupation Is Far Too Long: https://blog-cjpme.nationbuilder.com/cjpme_blog_2017_04_24
Alon Plan

Israeli cabinet minister Yigal Alon presented this plan for the occupied Palestinian territories on July 26, 1967 – barely 6 weeks after Israel had seized the West Bank in the 1967 War. The plan, which proposed to annex large areas of the West Bank (shown in grey on the map), including the Jordan Valley, has informed Israel’s official settlement enterprise ever since.
Note the similarity of the territory which Alon proposed that Israel annex in 1967 to the territory designated for exclusive Israeli control under the Oslo Accords 25 years later, shown on Map #10.
The Alon Plan demonstrates that, from the beginning, Israel intended to keep much of the West Bank – contrary to the myth that it somehow fell into the occupation and settlement enterprise unintentionally.
Image source: https://israeled.org/resources/documents/the-alon-plan/
The ABC’s of Occupation

The Oslo Accords of 1993 created a dizzying matrix of geographic areas of control in the occupied Palestinian territories: Area A (shown in brown on the map), nominally under exclusive Palestinian control; Area B (yellow), under joint Israeli/Palestinian control; and Area C (light blue), under exclusive Israeli control.
Palestinian negotiators saw these as zones of transition from Israeli to independent Palestinian rule – that territory under exclusive Israeli control in Area C would gradually be transferred to partial Palestinian control in Area B, and then eventually to exclusive Palestinian control in Area A. But compare this map to Map #9. Area C under the Oslo Accords, comprising 60% of the West Bank, corresponds closely to the area Israel had proposed to annex right from the beginning of the Occupation 25 years earlier. It would seem that Israel’s vision has always been to keep at least that much.
Israel uses the “civil control” powers that it claims to have under the Oslo Accords to impose planning and development regulations in Area C, which result in massive expropriations and demolitions of Palestinian property.
Image source: http://www.israeltoday.nl/NewsItem/tabid/381/nid/31764/language/nl-NL/Default.aspx
The settlement enterprise

Israeli settlement areas in the West Bank are shown in blue on this map. Israeli colonies experiencing stronger growth appear in darker shades. Population growth is particularly strong in the Israeli settlement corridors that cross the West Bank from Israel to the Jordan Valley. Similar patterns and motives underlie this settlement enterprise as the one during the British Mandate (See Map #3).
Image source: https://www.merip.org/primer-palestine-israel-arab-israeli-conflict-new
Israel’s Separation Barrier
Castle wall or prison wall?

Ostensibly designed as a shield to keep the Palestinians out, Israel’s Separation Barrier serves primarily to cage them in. As seen on this map, the Separation Barrier (shown in red, yellow and purple) and its associated regime of fenced-off limited-access highways (shown in green) snake around Bethlehem and neighbouring communities, isolating them. The Barrier stunts any possibility of development and creates narrow chokepoints which Israeli forces can close at a moment’s notice.
Image source: Applied Research Institute Jerusalem, quoted in http://cosmos.ucc.ie/cs1064/jabowen/IPSC/php/map.php?mid=164
City in a bottle

Qalqilya, a Palestinian city of 50,000 in the West Bank, is completely enclosed by Israel’s Separation Barrier, as seen in this photo taken from space.
There are only three ways in or out of Qalqilya: 1) an Israeli military base and checkpoint at the neck of the bottle enclosing the city (seen to the right in this photo); 2) a border terminal, seen at the top of the photo near the base of the bottle, which is used by day-labourers and other Palestinians with permits to work in Israel; and 3) a “Fabric-of-life” road, seen at the bottom of the photo.
Israeli forces can close these entrances and shut down the city at a moment’s notice. When that happens, produce can’t get to market, students and teachers can’t get to school, and workers can’t get to factories or offices. The economy is hobbled, social life disrupted, and the city and hinterland wither.
“Fabric-of-life” roads are internationally-funded infrastructure projects designed to mitigate the devastating impact of Israel’s Separation Barrier and associated regime of checkpoints on the Palestinian economy and social life.
Image source: Google Earth, https://www.google.com/earth/
Eastern Barrier

Many would be surprised to learn that, in addition to the already-constructed portion of the Separation Barrier, Israel plans to build an “Eastern Barrier” which, when finished, will completely seal in those areas of the West Bank that it intends to leave for the Palestinians.
Image source: http://forums.sherdog.com/threads/arab-israeli-conflict-part-1.3429825/page-30
Apartheid in Hebron

A series of Israeli colonies (the blue areas on this map), connected by corridors closed off to Palestinians (the purple areas), slice through the heart of Hebron, the West Bank’s largest city. In Hebron, the Occupation is found in its most concentrated and brutal form.
The same pattern of separating and isolating Palestinian centres that characterized the settlement enterprise during the British Mandate period (see Map #3), and continues today throughout the West Bank (see Map #11), is presented here in microcosm.
Image source: https://www.btselem.org/publications/summaries/200705_hebron
Territorial Ambitions
For further information, consult the following CJPME resources:
- Alternatives to a two-state solution: A realist perspective: http://www.cjpme.org/fs_093
West Bank in – Gaza out

This map, published by Israel’s National Water Company, Mekorot, shows that Israel has fully integrated the Palestinian West Bank and Syrian Golan Heights into its national water system. Israel never included Gaza (seen at the bottom left corner of the map) in the system, even though it maintained settlements there for over 35 years.
This map provides as clear an indication as any that Israel never intended to give up the West Bank and Golan Heights – or to keep Gaza.
Image source: Israel National Water Co. (Mekorot), quoted in https://waterscholar.files.wordpress.com/2015/01/ocr.jpg
Two-State Solution?

Is this Israel’s latest version of the “Two-State Solution”? According to this map, the two states consist of Israel, including all of the Palestinian West Bank and Syrian Golan Heights (shown in green on this map), on the one hand; and Gaza (purple) on the other.
Aware of international scrutiny, highly visible Israeli ministries like Foreign Affairs and Tourism now link to commercial map products rather than risk publishing their own. But the official government website (note the gov.il domain name) of the less-visible Minister of Education – Southern Region, however, is apparently less careful about concealing Israel’s territorial assumptions.
Image source: http://www.edu-negev.gov.il/td1997/mh98/map.htm
Natural Resources
For further information, consult the following CJPME resources:
- Water in Israel-Palestine: http://www.cjpme.org/list_factsheets
Ramallah gets as much rain as London

On this map, darker green shades indicate more rainfall, while red shades indicate less. Ramallah, Palestine and London, England both get about 600 mm of rain per year. No one would call London’s climate dry or its landscape parched. But while the West Bank gets the same amount of rainfall, Israel has deprived Palestinians of much of their water resources. Military orders issued immediately after the 1967 Occupation declared all water resources to be Israeli state property, preventing Palestinians from developing their groundwater resources and denying their riparian rights to the Jordan River.
Israel exploits more than 80% of the annual yield from groundwater basins in the West Bank. Water consumption by West Bank Palestinians is 73 litres a day per person, compared to 300 for Israelis. This is well below the World Health Organization minimum of 100 litres a day per person.
What happens with water is emblematic of Israel’s exploitation of many other natural resources in the occupied Palestinian territories.
Image source: http://proxy.arij.org/sefs/images/maps/environment/average-annual-rainfall.png
Man-made drought

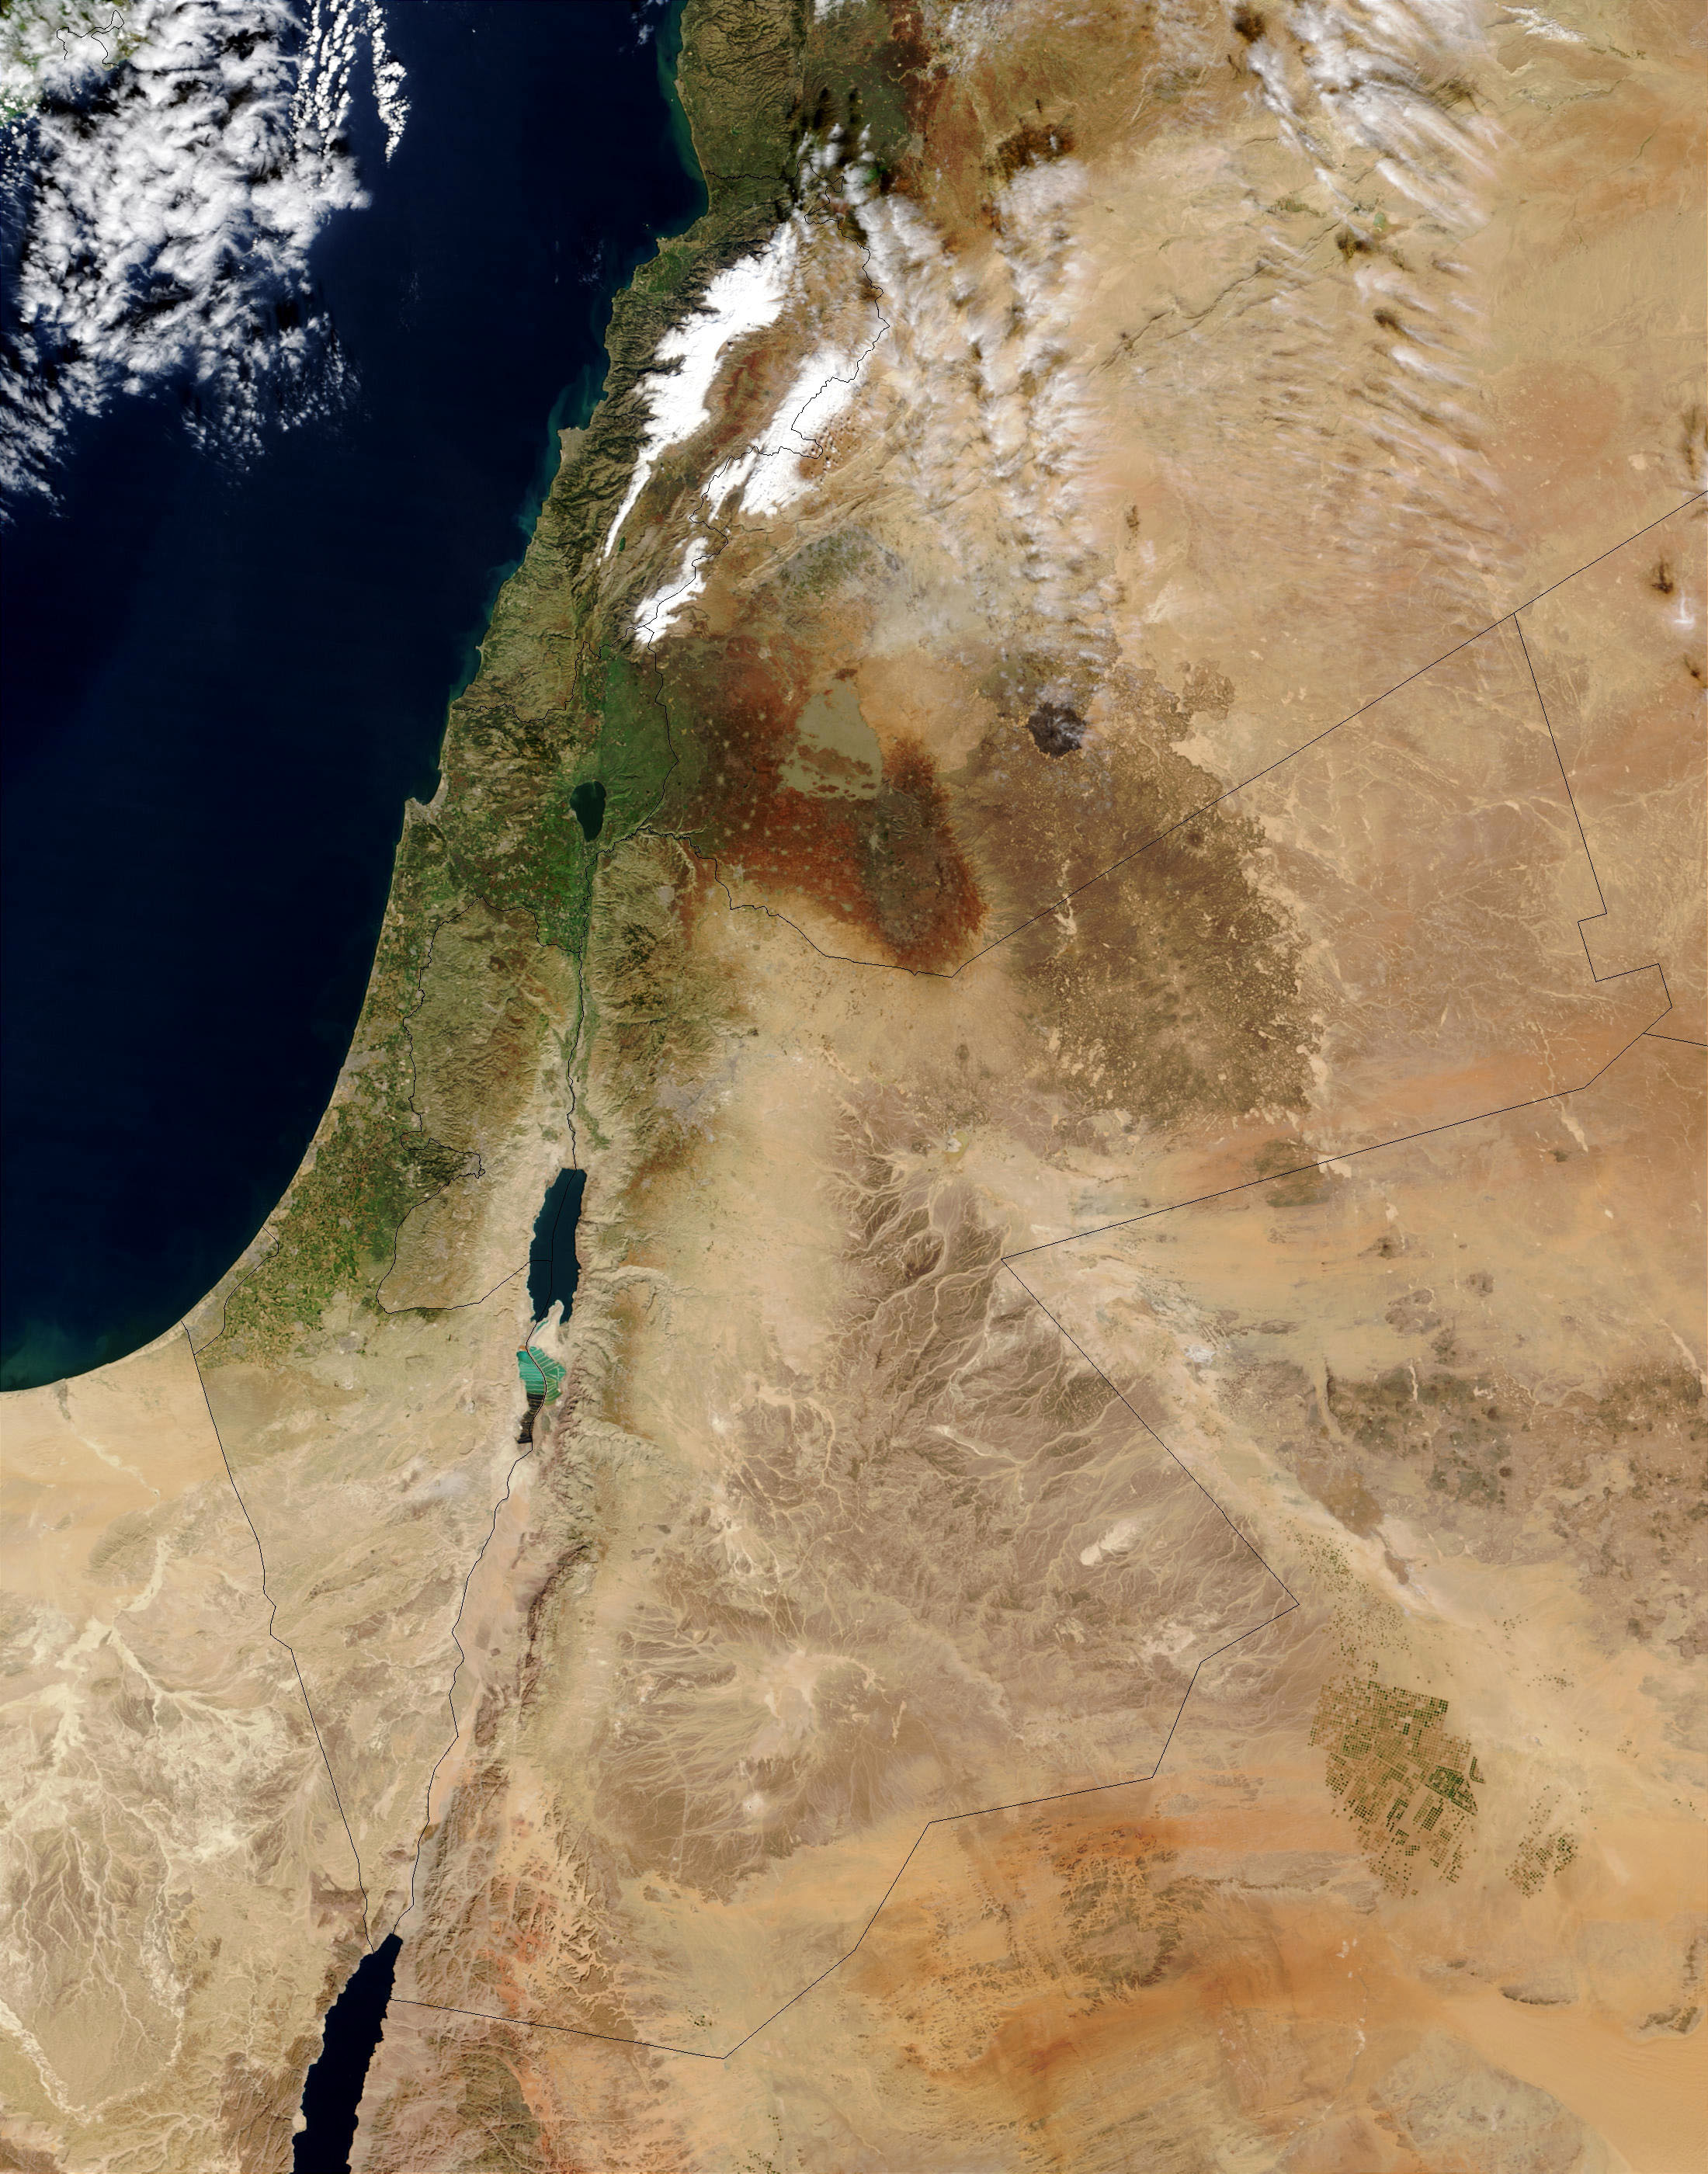
Even without the faint grey lines indicating their boundaries, the West Bank and the Gaza Strip can be clearly discerned on this NASA satellite image. Deprived of water resources, the Palestinian territories look parched compared to the well-irrigated green fields in Israel.
Image source: NASA, quoted in http://www.maps-of-the-world.net/maps/maps-of-asia/maps-of-israel/large-satellite-map-of-israel.jpg
Commander Hadfield in space

Canadian astronaut Chris Hadfield saw the Egyptian border when he tweeted from the International Space Station high above, but as his followers were quick to point out, he failed to see the equally visible border between the Gaza Strip and Israel at the top right of his photo. Gaza is parched. Israeli fields are well-irrigated.
Image source: https://twitter.com/Cmdr_Hadfield/status/292412432998088705
The Siege of Gaza
For further information, consult the following CJPME resources:
- Gaza’s fishing industry: http://www.cjpme.org/fs_174
- A child’s view from Gaza: http://www.cjpme.org/fs_144
- Psychological impact of war on children in Gaza: http://www.cjpme.org/fs_149
- The Russel Tribunal on Palestine: http://www.cjpme.org/fs_142
- The Palmer Report on the Gaza flotilla incident: http://www.cjpme.org/fs_137
- Canadian Boat to Gaza: http://www.cjpme.org/fs_126
- Did Israel loosen its illegal blockade of Gaza?: http://www.cjpme.org/fs_107
- Report of the UNHRC on Israel’s attack on the Gaza aid flotilla: http://www.cjpme.org/fs_100
- The Blockade of Gaza, 2007-2010: http://www.cjpme.org/fs_088
- The illegality of the Gaza blockade: http://www.cjpme.org/fs_087
- Israel’s attack on the Gaza Aid Flotilla: http://www.cjpme.org/fs_081
- Illegal Use of Weapons by Israeli during Gaza Assault: http://www.cjpme.org/fs_067
- Canada and Gaza: http://www.cjpme.org/pp_35
- Canada, Israel and the Blockade of Gaza: http://www.cjpme.org/pp_22
- Canada and the Gaza Aid Flotilla Attack: http://www.cjpme.org/pp_21
- Hamas: http://www.cjpme.org/fs_185
- Fatah, Hamas and Palestinian unity: http://www.cjpme.org/fs_131
No-go zones

Under the Oslo Accords, Gaza is entitled to a 20-nautical-mile fishing zone. Israel has arbitrarily reduced that limit to between 3 and 6 nautical miles, which it varies at whim. Israel also enforces a 500-metre-wide no-go zone (shown in red on this map) and a further 500-metre-wide “high risk area” (shown in orange) inside the barrier it has built surrounding Gaza.
Civilians entering these no-go zones risk being fired on by Israeli forces. Many were killed by Israeli snipers during the Great March of Return protests in 2018.
Among other things, Israel’s restrictions rob Gaza of a significant portion of its life-supporting agricultural lands and fishing fields.
Image source: https://www.ochaopt.org/content/between-fence-and-hard-place
Unfit for human consumption

Over 99% of Gaza’s water is unfit for human consumption. One parameter of water quality is its level of chloride (salinity). These maps show the levels of chloride in Gaza’s water in the years 2000 and 2010, plus predicted levels for 2020. Darker shades of green and red indicate higher levels of chloride.
The international standard for maximum chloride level in drinking water is 250 mg/litre – the very lightest of the green shades on the first two of these maps. All the rest of Gaza’s water exceeds that limit. Water from the red areas on the maps contains more than 1500 mg of chloride per litre (6 times the maximum limit), while the brown areas exceed 5000 mg/litre (20 times the maximum limit).
Image source: https://www.humanitarianresponse.info/system/files/documents/files/PWA%20-%20CSO-G%20updated%20Final.pdf
Hamas won an election, not a coup d’état

The January 2006 general elections in Palestine were declared free and fair by international observers and were widely hailed by the West – that is, until the vote results revealed that Hamas, and not the favoured Fatah party, had prevailed.
Hamas (the “Change and Reform” party, shown in green on this map) won a majority not only in Gaza, but also in the West Bank and East Jerusalem. Hamas won a larger percentage of the popular vote in Palestine (44%) than the Conservative party of Canada did (36%) when it won the general election in this country later that same month.
Hamas was never allowed to govern. In East Jerusalem and the West Bank, Israel arrested over 50 Hamas members of parliament, including the Speaker. Several countries, including Canada, broke off relations with the Palestinians.
Fatah also refused to accept its defeat at the polls. In 2007, armed Fatah forces attempted, but failed, to overthrow the rest of the Hamas government, which remained in Gaza.
Hamas did not stage a coup d’état in Gaza, as portrayed by the media. It defeated one.
Image source: http://www.wikiwand.com/en/Palestinian_legislative_election,_2006
International Relations
For further information, consult the following CJPME resources:
- Palestinian bid for statehood: http://www.cjpme.org/fs_124
- Palestine’s membership in UNESCO: http://www.cjpme.org/fs_141
- Palestinian membership in the UN and Palestinian "statehood": http://www.cjpme.org/pp_27
Who recognizes the State of Palestine?

Most of the world, outside of North America and Western Europe, recognizes the State of Palestine.
Image source: https://www.polgeonow.com/2013/05/who-recognizes-palestine-in-2013.html